During this assignment we graphed the postion vs time and velocity vs time.

The purpose of this assignment was to analyze the motion of a student walking across a room. We did this by predicting,sketching and testing velocity and position.
A object at rest.

A object at rest.
|
A object moving in a positive direction at a constant speed.
|

|

A object moving in a positive direction at a constant speed.
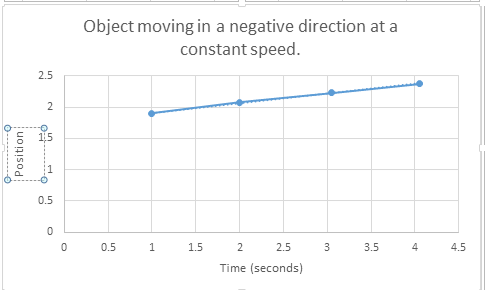
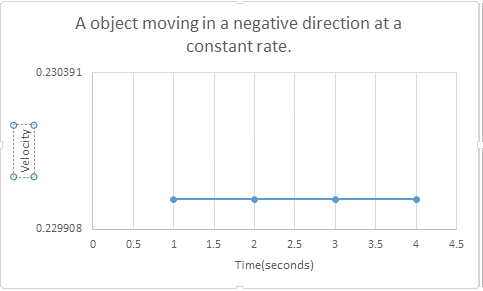
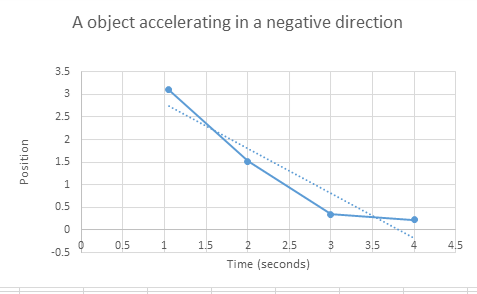
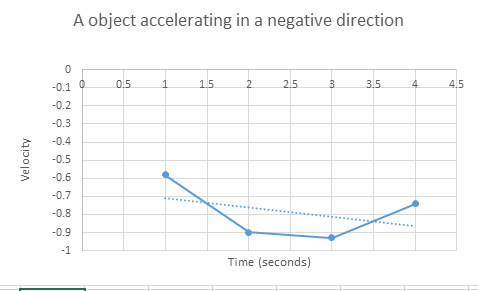
Conclusion- Graphs can be used to measure and predict future motion. During this lab project we used motion detectors to figure out our movement data. When you look at the graphs you should conclude be able to conclude if the data is positive or negative. When the object would move in a positive direction towards the motion detector the graph is positive. When the object would move away from the motion detector the graphs are negative.
Extension: What specific things do you have to do in order
to match the graph?
You must analyze the points and see if the graph should be negative or positive.
When you look at the graph if its a straight line then the object is at rest.
If the line is straight and diagonal then the object should have positively
to match the graph?
You must analyze the points and see if the graph should be negative or positive.
When you look at the graph if its a straight line then the object is at rest.
If the line is straight and diagonal then the object should have positively
